Hypothesis Testing
Since the values of our continuous variables, such as the age adjusted cancer rate, might vary between our categorical variables, such as each state’s (timezone) region, we performed an ANOVA (Analysis of Variance) and Student’s Paired t-tests to investigate the nature of these differences and whether they are statistically significant at the 95% confidence level. Importantly, we performed these types of hypothesis testing to identify whether the categorical variables encapsulated the differences in the continuous variables analyzed.
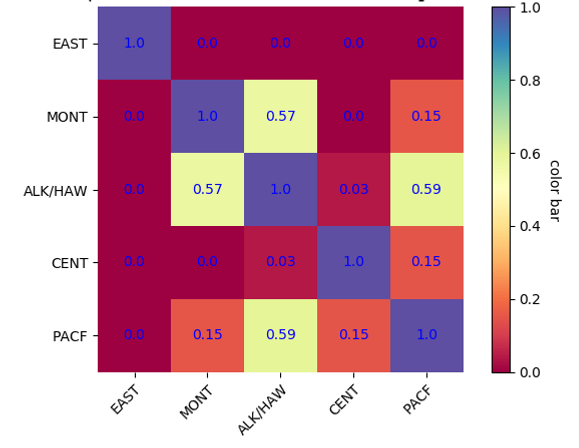
Heatmap of p-values for average cancer rate between regions
Region
Region
Null hypothesis: There is no statistically significant difference between the regions’ means for the average cancer rate
Alternative hypothesis: The average cancer rates are statistically different between the regions.
In this heatmap, the average regional cancer rate from 1999 to 2016 is compared between regions via a Student's paired t-test at the 95% confidence level. Importantly, Very red blocks in the plot represent regions with strong differences in the average cancer rate, while more blue blocks display a no statistically difference in the average cancer rate for these regions. Interestingly, the East region seems to have a statistically different cancer rate compared to each other region.
ANOVA Testing
A one-way ANOVA test was conducted on the EPA data for each of the numerical release estimate values. For each ANOVA, we compared the variables across regions. The lists of regional state averages (East, Central, Mountain, Alaska/Hawaii, Pacific) were used for the ANOVA. Below is a list of the f- and p-values of each ANOVA for the numerical release estimate values.
ANOVA for Release Estimate Variables Across Region
(Alaska included)


ANOVA for Release Estimate Variables Across Region
(Alaska excluded)
Null hypothesis: There is no statistically significant difference between the regions’ means for variable in question.
Alternative hypothesis: The means are statistically different between the regions.
If we choose a significance level of 0.05, then our results for SUM_REL_EST are statistically significant, so we can reject the null for SUM_REL_EST. We are unable to reject the null hypothesis for the remaining variables. However, if we exclude Alaska from the ANOVA testing, then AVG_REL_EST and STD_REL_EST are statistically significant. We can reject the null for these two variables, but we fail to reject the null for the remaining variables. This means the regions’ means for average release estimate and standard deviation are statistically significant, so there is significant variance of these variables across the different regions. Based on this analysis, we chose to use the Average Release Estimates for each type of release in our further analysis of chemical releases and its relationship with cancer incidence rates.